Interstate Deaths by State: Rates, Routes and Counties, 2020 to 2024
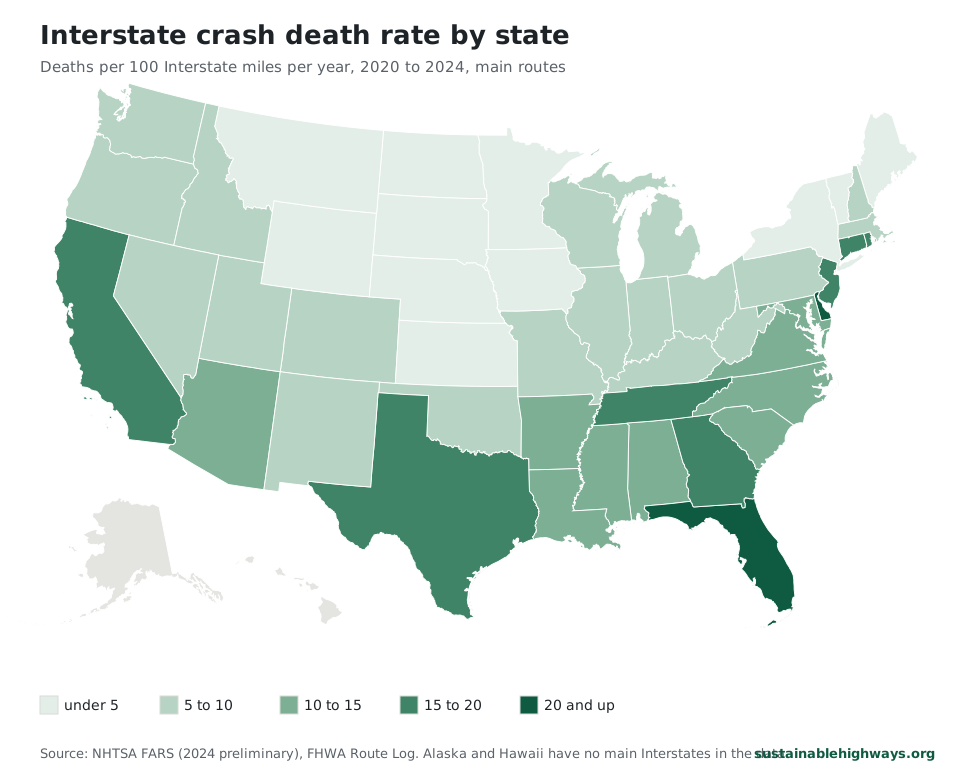
Florida has the highest Interstate death rate of any state with more than 1,000 Interstate miles, 20.5 deaths per 100 miles a year from 2020 to 2024, and Texas has the most deaths at 2,564. Delaware ranks first at 22.2, but on just 26 deaths along 23 miles of I-95. North Dakota is lowest at 1.8.
- Highest Interstate death rate, 22.2
- Delaware
- Lowest, 1.8
- North Dakota
- Most Interstate deaths, 2,564
- Texas
- Contiguous states ranked
- 48
Six things the state Interstate figures show
- Delaware ranks first at 22.2 deaths per 100 miles a year, a figure built on 26 deaths along 23.43 miles of I-95. Each death more or less moves its rate by about 0.9.
- Of the 15 states with more than 1,000 Interstate miles, Florida has the highest rate at 20.5, ahead of California at 19.8 and Georgia at 18.2.
- Texas had 2,564 Interstate deaths, 12.4% of the 20,668 counted across the 48 states. Texas, California and Florida together account for 28.0% of the deaths on 15.3% of the miles.
- North Dakota has the lowest rate, 1.8. Florida's rate is 11.4 times as high.
- In 19 states, the route with the highest death rate is a different road from the one with the most deaths. Texas's top rate is on I-69 at 28.3, while I-35 had the most deaths, 631.
- I-95 has the highest rate of any route in 9 of the 14 states where it is long enough to rate, led by Florida and Pennsylvania at 30.8. In three of the nine, Delaware, Rhode Island and Maine, it is the only main Interstate.
States ranked by Interstate deaths per 100 miles
Six states are at 18 or more deaths per 100 Interstate miles a year: Delaware at 22.2, Florida at 20.5, California at 19.8, Georgia at 18.2, Connecticut at 18.1 and Rhode Island at 18.0. Across all 48 states, crashes on main Interstate mainlines killed 20,668 people from 2020 to 2024. That works out to 9.8 deaths per 100 miles a year, and 19 states are above it.
The ranking covers Interstates only. Most lists of the most dangerous states for driving count deaths on every road and divide by population or by miles traveled, a separate question with a separate answer. On that all-roads basis, IIHS put Mississippi highest in 2024 at 25.6 deaths per 100,000 people and Rhode Island lowest at 4.7. On Interstates per mile, Mississippi ranks 18th at 10.9 and Rhode Island 6th. The all-roads numbers for every state are in our traffic deaths by state table.
State miles count shared pavement once. Where two Interstates run on the same road, as I-20 and I-59 do across much of Alabama, the FHWA Route Log books those miles to only one of the two, and we add up those rows. Each crash counts under the one route named in its FARS trafficway field, so a death on the shared section also counts once. Lettered branches such as I-35E and I-35W in Texas are part of their state's total.
Delaware and Rhode Island rank high on small counts: 26 and 39 deaths in five years. One death moves Delaware's rate by 0.9 and Rhode Island's by 0.5, and five fewer deaths would drop Delaware to 17.9, below five other states. The rate is also blind to traffic. It divides deaths by miles of road, so a crowded urban state and an empty rural one are compared on pavement alone.
Select a column heading to sort.
| 1 | Delaware | 22.2 | 26 | 23.4 |
|---|---|---|---|---|
| 2 | Florida | 20.5 | 1,379 | 1,346.6 |
| 3 | California | 19.8 | 1,836 | 1,852.4 |
| 4 | Georgia | 18.2 | 940 | 1,030.6 |
| 5 | Connecticut | 18.1 | 242 | 267.6 |
| 6 | Rhode Island | 18.0 | 39 | 43.3 |
| 7 | New Jersey | 16.4 | 188 | 228.7 |
| 8 | Texas | 15.9 | 2,564 | 3,231.5 |
| 9 | Tennessee | 15.6 | 810 | 1,038.7 |
| 10 | Maryland | 14.4 | 249 | 346.5 |
| 11 | South Carolina | 13.8 | 522 | 758.5 |
| 12 | Alabama | 13.0 | 605 | 933.7 |
| 13 | Louisiana | 12.8 | 563 | 879.2 |
| 14 | Arizona | 12.1 | 708 | 1,169.6 |
| 15 | Virginia | 11.6 | 565 | 974.4 |
| 16 | North Carolina | 11.2 | 669 | 1,189.4 |
| 17 | Arkansas | 11.2 | 351 | 624.5 |
| 18 | Mississippi | 10.9 | 432 | 790.9 |
| 19 | New Mexico | 9.9 | 494 | 999.4 |
| 20 | Washington | 9.4 | 331 | 706.0 |
| 21 | Oklahoma | 9.3 | 408 | 881.4 |
| 22 | Massachusetts | 9.2 | 155 | 338.0 |
| 23 | Colorado | 9.0 | 422 | 932.8 |
| 24 | Ohio | 9.0 | 579 | 1,285.7 |
| 25 | Missouri | 8.9 | 549 | 1,233.2 |
| 26 | Kentucky | 8.6 | 350 | 813.3 |
| 27 | Illinois | 7.5 | 729 | 1,944.1 |
| 28 | Nevada | 7.5 | 220 | 588.4 |
| 29 | Indiana | 7.3 | 446 | 1,214.7 |
| 30 | Michigan | 7.3 | 386 | 1,057.0 |
| 31 | Oregon | 6.2 | 215 | 695.3 |
| 32 | Pennsylvania | 6.1 | 465 | 1,520.0 |
| 33 | West Virginia | 6.0 | 166 | 551.7 |
| 34 | Utah | 5.5 | 250 | 913.9 |
| 35 | Wisconsin | 5.3 | 230 | 871.7 |
| 36 | New Hampshire | 5.3 | 55 | 208.6 |
| 37 | Idaho | 5.1 | 156 | 608.4 |
| 38 | Nebraska | 4.8 | 111 | 458.1 |
| 39 | Kansas | 4.5 | 148 | 659.1 |
| 40 | Iowa | 4.4 | 146 | 656.5 |
| 41 | Minnesota | 3.6 | 150 | 836.2 |
| 42 | New York | 3.5 | 241 | 1,375.3 |
| 43 | Maine | 3.4 | 52 | 303.1 |
| 44 | Wyoming | 3.4 | 154 | 911.6 |
| 45 | Montana | 3.1 | 183 | 1,190.7 |
| 46 | South Dakota | 3.0 | 99 | 665.4 |
| 47 | Vermont | 2.4 | 39 | 318.8 |
| 48 | North Dakota | 1.8 | 51 | 569.9 |
Each state's deadliest Interstate, by rate and by deaths
The highest route rates in any state are on I-95 in Pennsylvania and Florida, both at 30.8 deaths per 100 miles a year. Pennsylvania's figure covers 41.53 miles around Philadelphia and Florida's covers 381.93. Three more state stretches top 28: the Illinois part of I-94 (28.4), the Texas part of I-69 (28.3) and the California part of I-10 (28.2).
A deadly route can sit inside a low-ranked state, because the statewide rate spreads deaths over every rural mile too. Pennsylvania ranks 32nd overall at 6.1 and New York 42nd at 3.5, yet New York's 23.47 miles of I-95 run at 23.0.
In Florida, I-95's rate is higher than that of I-4, the road a widely shared 2021 Teletrac Navman ranking, based on 2016 to 2019 data, called the most dangerous highway in the country. I-4 had 167 deaths on 131.89 miles, 25.3 per 100 miles a year, the second highest rate of any whole Interstate. Florida's I-95 had 588 deaths at 30.8.
Route rates use each route's own miles in the state, counting pavement it shares with another route, so they match the figures on our route guides and do not add up to the state rate. A route needs at least 20 miles in the state and 100 miles in all to get a rate. That rule leaves out Louisiana's I-12, 86.65 miles long, whose 99 deaths work out to 22.9, above I-10's 18.1 in the table. The most-deaths column is a raw count that favors long routes: I-5 in California had 735, the most of any route in one state.
Select a column heading to sort.
| Alabama | I-10 | 14.8 | I-65 | 257 |
|---|---|---|---|---|
| Arizona | I-17 | 18.0 | I-10 | 333 |
| Arkansas | I-30 | 16.4 | I-40 | 156 |
| California | I-10 | 28.2 | I-5 | 735 |
| Colorado | I-25 | 13.1 | I-25 | 196 |
| Connecticut | I-91 | 23.4 | I-95 | 92 |
| Delaware | I-95 | 22.2 | I-95 | 26 |
| Florida | I-95 | 30.8 | I-95 | 588 |
| Georgia | I-20 | 23.1 | I-75 | 371 |
| Idaho | I-84 | 6.2 | I-84 | 85 |
| Illinois | I-94 | 28.4 | I-55 | 154 |
| Indiana | I-65 | 10.2 | I-65 | 133 |
| Iowa | I-80 | 6.0 | I-80 | 88 |
| Kansas | I-35 | 5.2 | I-70 | 87 |
| Kentucky | I-65 | 13.8 | I-65 | 95 |
| Louisiana | I-10 | 18.1 | I-10 | 249 |
| Maine | I-95 | 3.4 | I-95 | 52 |
| Maryland | I-95 | 24.2 | I-95 | 133 |
| Massachusetts | I-93 | 21.2 | I-93 | 49 |
| Michigan | I-94 | 10.7 | I-94 | 145 |
| Minnesota | I-94 | 4.4 | I-35 | 65 |
| Mississippi | I-10 | 16.2 | I-55 | 164 |
| Missouri | I-70 | 13.7 | I-70 | 171 |
| Montana | I-90 | 4.8 | I-90 | 130 |
| Nebraska | I-80 | 4.9 | I-80 | 111 |
| Nevada | I-15 | 17.0 | I-15 | 105 |
| New Hampshire | I-93 | 5.9 | I-93 | 39 |
| New Jersey | I-95 | 18.8 | I-95 | 84 |
| New Mexico | I-40 | 13.1 | I-40 | 244 |
| New York | I-95 | 23.0 | I-87 | 93 |
| North Carolina | I-85 | 15.6 | I-40 | 202 |
| North Dakota | I-94 | 2.1 | I-94 | 37 |
| Ohio | I-75 | 12.9 | I-75 | 136 |
| Oklahoma | I-35 | 10.1 | I-40 | 147 |
| Oregon | I-5 | 8.0 | I-5 | 124 |
| Pennsylvania | I-95 | 30.8 | I-81 | 107 |
| Rhode Island | I-95 | 18.0 | I-95 | 39 |
| South Carolina | I-77 | 18.0 | I-26 | 163 |
| South Dakota | I-90 | 3.4 | I-90 | 70 |
| Tennessee | I-24 | 22.4 | I-40 | 353 |
| Texas | I-69 | 28.3 | I-35 | 631 |
| Utah | I-15 | 7.7 | I-15 | 157 |
| Vermont | I-89 | 4.3 | I-89 | 28 |
| Virginia | I-95 | 20.6 | I-95 | 184 |
| Washington | I-5 | 14.2 | I-5 | 196 |
| West Virginia | I-81 | 16.9 | I-77 | 49 |
| Wisconsin | I-41 | 6.2 | I-94 | 67 |
| Wyoming | I-80 | 4.7 | I-80 | 95 |
The county with the most Interstate deaths in each state
San Bernardino County, California had more Interstate deaths than any other county from 2020 to 2024, 374. Harris County, Texas had 350 and Dallas County, Texas 337, then San Diego County at 290 and Los Angeles County at 263, both in California. Outside Texas and California, Cook County, Illinois led with 253 and Maricopa County, Arizona followed at 235.
In a few states one county holds a large share. Clark County had 119 of Nevada's 220 Interstate deaths, 54.1%, and Cook County had 34.7% of Illinois's. All 26 of Delaware's deaths were in New Castle County, and Providence County had 18 of Rhode Island's 39.
These are plain totals with no adjustment for a county's size, Interstate miles or traffic. In rural states a few crashes decide the top spot: Pennington County leads South Dakota with 12 deaths, and Windsor County leads Vermont with 11.
Select a column heading to sort.
| Alabama | Jefferson County | 126 |
|---|---|---|
| Arizona | Maricopa County | 235 |
| Arkansas | Pulaski County | 57 |
| California | San Bernardino County | 374 |
| Colorado | El Paso and Adams Counties | 49 |
| Connecticut | Hartford County | 83 |
| Delaware | New Castle County | 26 |
| Florida | Broward County | 143 |
| Georgia | Fulton County | 149 |
| Idaho | Elmore County | 23 |
| Illinois | Cook County | 253 |
| Indiana | Lake County | 58 |
| Iowa | Polk County | 25 |
| Kansas | Wyandotte County | 23 |
| Kentucky | Jefferson County | 57 |
| Louisiana | Orleans Parish | 70 |
| Maine | York and Kennebec Counties | 13 |
| Maryland | Prince George's County | 54 |
| Massachusetts | Middlesex County | 33 |
| Michigan | Wayne County | 116 |
| Minnesota | Hennepin County | 34 |
| Mississippi | Hinds County | 54 |
| Missouri | St. Louis City | 60 |
| Montana | Jefferson County | 23 |
| Nebraska | Douglas County | 15 |
| Nevada | Clark County | 119 |
| New Hampshire | Merrimack County | 17 |
| New Jersey | Essex County | 24 |
| New Mexico | Bernalillo County | 116 |
| New York | Bronx County | 41 |
| North Carolina | Mecklenburg County | 80 |
| North Dakota | Cass County | 13 |
| Ohio | Cuyahoga County | 80 |
| Oklahoma | Oklahoma County | 93 |
| Oregon | Multnomah County | 37 |
| Pennsylvania | Philadelphia County | 51 |
| Rhode Island | Providence County | 18 |
| South Carolina | Richland County | 60 |
| South Dakota | Pennington County | 12 |
| Tennessee | Davidson County | 118 |
| Texas | Harris County | 350 |
| Utah | Salt Lake County | 37 |
| Vermont | Windsor County | 11 |
| Virginia | Henrico County | 28 |
| Washington | King County | 90 |
| West Virginia | Kanawha County | 30 |
| Wisconsin | Milwaukee County | 34 |
| Wyoming | Sweetwater County | 37 |
How we counted Interstate deaths and miles by state
Deaths come from NHTSA's Fatality Analysis Reporting System (FARS) for 2020 through 2024. We kept crashes that FARS codes as on an Interstate and whose trafficway names a one- or two-digit route. Ramps, exits, frontage and service roads, business routes and three-digit spurs such as I-495 are left out, as are records placed in a state the route never enters. The 2024 data is NHTSA's annual file; the final file, which can revise counts, comes about a year later.
A state's rate is its yearly average of deaths per 100 miles of main Interstate. Florida's 1,379 deaths over five years, divided by five and then by its 1,346.58 miles, give 20.5 per 100 miles.
State miles start from each main route's state rows in the FHWA Route Log, plus the rows for lettered branches. The Route Log credits shared pavement to one route only, so the sum counts each mile once. Adding each route's full length instead would count shared miles twice and push the rate down. That is why the 48-state figure here, 9.8, sits a little above the 9.5 network average on our route guides, which count shared miles under every route that uses them and leave out routes shorter than 100 miles.
We corrected rows that are misprinted or that describe road not signed as an Interstate during these years. Tennessee's I-81 row prints 1.96 miles; we use 75.66, the length Wikipedia and Interstate Guide give. Tennessee's I-75 uses its 161.86 end-to-end miles less the 19.60 miles shared with I-40, which I-40's row already holds. Minnesota's I-35 row already holds both Twin Cities branches, about 220 miles of I-35 plus I-35E and I-35W, so they are not added twice. Tennessee's I-69 and Arkansas's I-57 count as zero miles. Tennessee's I-69 is still unsigned, and Arkansas's I-57 was designated on November 7, 2024 and signed from March 2025, so FARS codes no 2020 to 2024 crash to either. In South Texas, the I-69C, I-69E and I-69W branches are left out of both deaths and miles. FHWA's Table 1 shows only the Texas I-69 mainline, and the three branches appear as routes of their own in Table 3.
Route rates within a state use that route's own miles, including pavement it shares with another route, because a state may code a crash on a shared section under either number. Routes with less than 20 miles in a state, or less than 100 miles overall, get no rate. Alaska, Hawaii and Puerto Rico have no main Interstates in this data, and Washington, D.C. is left out.
The rate does not include traffic volume, so it cannot say how risky a trip is per mile driven. FARS records where a fatal crash happened, not why it happened, and nothing here explains why one state ranks above another. A crash whose trafficway was recorded without an Interstate number is not counted. Small states move on a handful of deaths, so read Delaware, Rhode Island and Vermont with that in mind.
Questions about Interstate deaths by state
What is the most dangerous Interstate in each state?
It depends on whether you rank by rate or by count. By deaths per 100 miles a year, I-95 has the highest rate in nine states, including Florida and Pennsylvania at 30.8; in Texas the top rate is on I-69 (28.3) and in California on I-10 (28.2). By total deaths the leaders are longer roads, such as I-5 in California with 735 and I-35 in Texas with 631. The route table lists both for all 48 states.
Which state has the most Interstate deaths?
Texas, with 2,564 deaths on main Interstate mainlines from 2020 to 2024. California had 1,836 and Florida 1,379. Texas also has the most Interstate miles in this data, 3,231.48.
What is the most dangerous state for driving?
On all roads, IIHS ranked Mississippi highest in 2024 at 25.6 deaths per 100,000 people. On Interstate mainlines per mile, Delaware is first at 22.2 on only 26 deaths, and Florida is highest among states with more than 1,000 Interstate miles at 20.5. The two rankings measure different things.
Which state has the lowest Interstate death rate?
North Dakota, at 1.8 deaths per 100 miles a year: 51 deaths on 569.87 miles over five years. Vermont at 2.4, South Dakota at 3.0 and Montana at 3.1 are the next lowest. The rate does not adjust for traffic, so a low figure does not show the risk of a single trip.
Why does Delaware rank first?
Delaware has one main Interstate, 23.43 miles of I-95, and 26 people died on it in five years. A total that small swings easily: five fewer deaths would put Delaware at 17.9, behind five other states.
Is I-4 the deadliest Interstate in Florida?
Not on this measure. From 2020 to 2024, I-4 had 167 deaths on 131.89 miles, or 25.3 per 100 miles a year. Florida's I-95 ran at 30.8 and had 588 deaths, the most of any Florida route.
Which county has the most Interstate deaths?
San Bernardino County, California, with 374 from 2020 to 2024. Harris County, Texas had 350 and Dallas County, Texas had 337.
Does a high rate mean a trip on that Interstate is riskier?
Not by itself. The rate counts deaths per mile of road and leaves out how many vehicles use it. A busy urban stretch can post a high rate per mile while each vehicle on it faces a lower risk per mile traveled.