The Deadliest Interstates: Crash Deaths per Mile, 2020 to 2024
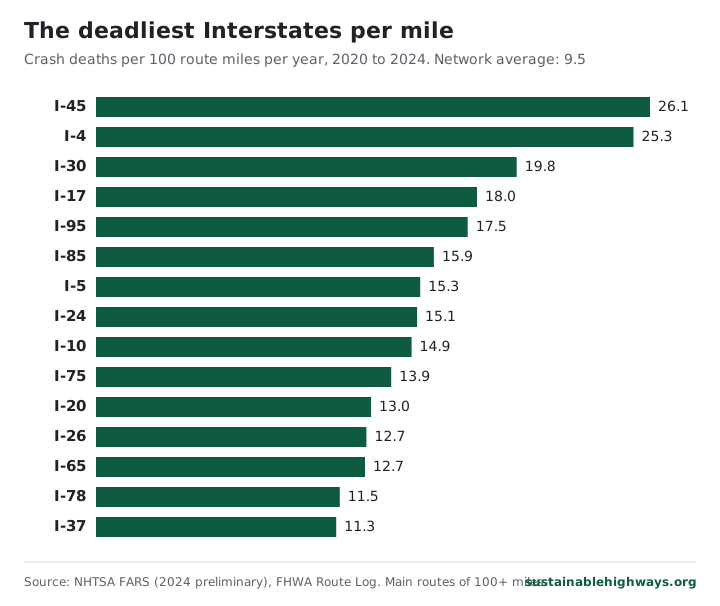
I-45 in Texas is the deadliest Interstate per mile. Crashes on its mainline killed 372 people from 2020 to 2024, or 26.1 deaths per 100 route miles a year, about 2.7 times the rate for the system as a whole. I-10 has the most deaths of any route, 1,827, spread over 8.6 times as many rate miles.
- Deaths on main Interstates, 2020 to 2024
- 20,669
- Deaths per 100 route miles per year, network
- 9.5
- Highest rate, 26.1 per 100 miles a year
- I-45
- Routes of 100+ miles ranked
- 56
What the 2020 to 2024 crash data shows
- I-45 has the highest death rate of the 56 long Interstates: 26.1 per 100 route miles a year, against 9.5 for the network. That works out to about one death a year for every 3.8 miles of road.
- I-4, the road per-mile lists such as Teletrac Navman's put first, is a close second at 25.3. Its 131.89 miles between Tampa and Daytona Beach saw 167 deaths.
- I-10 killed the most people, 1,827, followed by I-95 with 1,668. The ten routes with the highest totals account for 11,596 deaths, 56.1% of the 20,669 on main Interstates.
- Florida's 381.93 miles of I-95 are the deadliest state stretch of 50 miles or more at 30.8 deaths per 100 miles a year. Its 588 deaths are 35.3% of the route's total.
- Deaths on main Interstates peaked at 4,579 in 2021 and fell each year after, to 3,872 in the preliminary 2024 count. That is still 14 more than in 2020.
- I-72 in Illinois and Missouri has the lowest rate, 1.8, with 16 deaths over 179.31 miles.
Deaths per mile: I-45 and I-4 lead the ranking
Ranked by deaths per mile of road, I-45 comes first at 26.1 deaths per 100 route miles a year and I-4 second at 25.3. The next three are I-30 at 19.8, I-17 at 18.0 and I-95 at 17.5. Of the 56 routes ranked, 23 sit above the network rate of 9.5, and the median rate is 7.8.
The rate takes a route's average deaths per year and divides by its rate miles, then scales the result to 100 miles. A short road can rank near the top with a modest count. I-4 recorded 167 deaths in five years, fewer than the 340 on I-10's California stretch alone, but it packs them into 131.89 miles. I-17 in Arizona ranks fourth with 131 deaths on 145.95 miles.
The rate is per mile of road, not per mile driven, because FARS does not record how much traffic a road carries. A high rate means more people died on each mile of that Interstate. It does not show whether a single trip on it carries more risk than a trip on a quieter route. At the bottom of the list, I-72 (1.8), I-86 (2.1) and I-29 (2.4) each had fewer than 100 deaths in five years, so a handful of crashes moves them.
Select a column heading to sort.
| 1 | I-45 | 26.1 | 372 | 285.0 | TX |
|---|---|---|---|---|---|
| 2 | I-4 | 25.3 | 167 | 131.9 | FL |
| 3 | I-30 | 19.8 | 364 | 367.3 | TX, AR |
| 4 | I-17 | 18.0 | 131 | 146.0 | AZ |
| 5 | I-95 | 17.5 | 1,668 | 1,904.6 | FL, GA, SC, NC, VA, MD, DE, PA, NJ, NY, CT, RI, MA, NH, ME |
| 6 | I-85 | 15.9 | 535 | 672.0 | AL, GA, SC, NC, VA |
| 7 | I-5 | 15.3 | 1,055 | 1,381.4 | CA, OR, WA |
| 8 | I-24 | 15.1 | 240 | 317.3 | IL, KY, TN, GA |
| 9 | I-10 | 14.9 | 1,827 | 2,457.6 | CA, AZ, NM, TX, LA, MS, AL, FL |
| 10 | I-75 | 13.9 | 1,238 | 1,779.9 | FL, GA, TN, KY, OH, MI |
| 11 | I-20 | 13.0 | 999 | 1,541.2 | TX, LA, MS, AL, GA, SC |
| 12 | I-26 | 12.7 | 209 | 328.0 | NC, SC, TN |
| 13 | I-65 | 12.7 | 563 | 888.6 | AL, TN, KY, IN |
| 14 | I-78 | 11.5 | 84 | 146.2 | PA, NJ, NY |
| 15 | I-37 | 11.3 | 81 | 143.2 | TX |
| 16 | I-35 | 11.0 | 937 | 1,706.0 | TX, OK, KS, MO, IA, MN |
| 17 | I-40 | 10.8 | 1,380 | 2,552.9 | CA, AZ, NM, TX, OK, AR, TN, NC |
| 18 | I-59 | 10.3 | 228 | 444.8 | LA, MS, AL, GA |
| 19 | I-96 | 10.0 | 96 | 192.3 | MI |
| 20 | I-55 | 9.9 | 477 | 963.6 | LA, MS, TN, AR, MO, IL |
| 21 | I-15 | 9.8 | 709 | 1,446.3 | CA, NV, AZ, UT, ID, MT |
| 22 | I-44 | 9.7 | 305 | 626.3 | TX, OK, MO |
| 23 | I-71 | 9.6 | 165 | 344.2 | KY, OH |
| 24 | I-93 | 9.3 | 88 | 188.9 | MA, NH, VT |
| 25 | I-77 | 8.7 | 269 | 615.6 | SC, NC, VA, WV, OH |
| 26 | I-8 | 8.6 | 150 | 348.8 | CA, AZ |
| 27 | I-81 | 8.2 | 352 | 855.0 | TN, VA, WV, MD, PA, NY |
| 28 | I-25 | 8.1 | 431 | 1,060.6 | NM, CO, WY |
| 29 | I-57 | 7.4 | 143 | 386.5 | AR, MO, IL |
| 30 | I-16 | 7.4 | 61 | 165.7 | GA |
| 31 | I-80 | 7.1 | 1,035 | 2,900.2 | CA, NV, UT, WY, NE, IA, IL, IN, OH, PA, NJ |
| 32 | I-22 | 6.9 | 70 | 203.2 | MS, AL |
| 33 | I-70 | 6.9 | 748 | 2,177.5 | UT, CO, KS, MO, IL, IN, OH, WV, PA, MD |
| 34 | I-64 | 6.9 | 332 | 968.8 | MO, IL, IN, KY, WV, VA |
| 35 | I-91 | 6.8 | 99 | 290.5 | CT, MA, VT |
| 36 | I-69 | 6.6 | 251 | 762.5 | IN, MI, KY, MS, TN, TX |
| 37 | I-49 | 6.3 | 176 | 555.3 | LA, AR, MO |
| 38 | I-41 | 6.1 | 54 | 177.0 | IL, WI |
| 39 | I-84 | 6.1 | 304 | 1,001.4 | OR, ID, UT, PA, NY, CT, MA |
| 40 | I-87 | 6.1 | 105 | 346.7 | NY, NC |
| 41 | I-27 | 5.9 | 38 | 128.4 | TX |
| 42 | I-82 | 5.8 | 42 | 143.8 | WA, OR |
| 43 | I-94 | 5.6 | 451 | 1,598.3 | MT, ND, MN, WI, IL, IN, MI |
| 44 | I-76 | 5.4 | 167 | 623.1 | CO, NE, OH, PA, NJ |
| 45 | I-43 | 5.0 | 47 | 187.8 | WI |
| 46 | I-73 | 4.6 | 29 | 125.1 | NC |
| 47 | I-74 | 4.3 | 113 | 526.1 | IA, IL, NC, IN, OH |
| 48 | I-79 | 4.2 | 72 | 339.9 | WV, PA |
| 49 | I-68 | 4.2 | 24 | 115.6 | WV, MD |
| 50 | I-90 | 3.9 | 608 | 3,095.3 | WA, ID, MT, WY, SD, MN, WI, IL, IN, OH, PA, NY, MA |
| 51 | I-89 | 3.9 | 37 | 191.1 | NH, VT |
| 52 | I-39 | 3.7 | 59 | 322.1 | IL, WI |
| 53 | I-88 | 3.0 | 39 | 258.0 | IL, NY |
| 54 | I-29 | 2.4 | 91 | 763.7 | MO, IA, SD, ND |
| 55 | I-86 | 2.1 | 34 | 317.0 | ID, NY, PA |
| 56 | I-72 | 1.8 | 16 | 179.3 | IL, MO |
Total deaths: I-10 and I-95 lose the most lives
I-10 had more crash deaths than any other Interstate from 2020 to 2024, 1,827, or about 365 a year. I-95 follows with 1,668 and I-40 with 1,380. Together the ten routes in this table account for 11,596 deaths, 56.1% of the five-year total.
Totals mostly track length. I-80 has the sixth-highest count at 1,035, yet its rate of 7.1 ranks 31st and sits below the network figure. I-70 is ninth on deaths with 748 and 33rd on rate. I-90, with the most rate miles at 3,095.33, recorded 608 deaths and a rate of 3.9, 50th of 56. I-45, by contrast, has 372 deaths on 285.03 miles.
Some routes rank high both ways. I-95 is second on deaths and fifth on rate, I-5 is fifth and seventh, and I-10 is first and ninth. So the answer depends on the question: the Interstate that kills the most people is I-10, and the Interstate with the most deaths for each mile of its length is I-45.
Select a column heading to sort.
| I-10 | 1,827 | 2,457.6 |
|---|---|---|
| I-95 | 1,668 | 1,904.6 |
| I-40 | 1,380 | 2,552.9 |
| I-75 | 1,238 | 1,779.9 |
| I-5 | 1,055 | 1,381.4 |
| I-80 | 1,035 | 2,900.2 |
| I-20 | 999 | 1,541.2 |
| I-35 | 937 | 1,706.0 |
| I-70 | 748 | 2,177.5 |
| I-15 | 709 | 1,446.3 |
State stretches: Florida's I-95 is the deadliest piece of Interstate
Broken out by state, I-95 in Florida has the highest rate of any stretch 50 miles or longer: 30.8 deaths per 100 miles a year across 381.93 miles. Its 588 deaths are 35.3% of all deaths on I-95. Next come I-94 in Illinois at 28.4, I-69 in Texas at 28.3 and I-10 in California at 28.2.
A long route's overall rate can hide a much worse stretch. I-94 ranks 43rd of 56 at 5.6, but its 77.44 miles in Illinois run at 28.4. I-80 averages 7.1 and reaches 23.4 in California. I-15 averages 9.8 and reaches 24.5 in California. I-10's California rate of 28.2 is close to double its route figure of 14.9.
Texas and California each have four of the 25 stretches in this table, and Florida and Georgia three each. I-95 appears four times, in Florida, Maryland, Virginia and New Jersey. Stretches shorter than 50 miles, and those on routes under 100 miles such as I-12, are not in the table, since their rates can jump on one or two crashes.
Select a column heading to sort.
| I-95 | Florida | 30.8 | 588 | 381.9 |
|---|---|---|---|---|
| I-94 | Illinois | 28.4 | 110 | 77.4 |
| I-69 | Texas | 28.3 | 117 | 82.8 |
| I-10 | California | 28.2 | 340 | 241.0 |
| I-45 | Texas | 26.1 | 372 | 285.0 |
| I-4 | Florida | 25.3 | 167 | 131.9 |
| I-15 | California | 24.5 | 352 | 287.3 |
| I-95 | Maryland | 24.2 | 133 | 110.0 |
| I-80 | California | 23.4 | 238 | 203.1 |
| I-91 | Connecticut | 23.4 | 68 | 58.2 |
| I-20 | Georgia | 23.1 | 233 | 201.5 |
| I-24 | Tennessee | 22.4 | 203 | 181.1 |
| I-30 | Texas | 22.0 | 247 | 224.3 |
| I-35 | Texas | 21.3 | 631 | 592.0 |
| I-75 | Georgia | 20.9 | 371 | 354.7 |
| I-85 | Georgia | 20.8 | 188 | 181.0 |
| I-95 | Virginia | 20.6 | 184 | 178.3 |
| I-95 | New Jersey | 18.8 | 84 | 89.2 |
| I-5 | California | 18.5 | 735 | 796.5 |
| I-10 | Louisiana | 18.1 | 249 | 274.7 |
| I-77 | South Carolina | 18.0 | 82 | 91.1 |
| I-17 | Arizona | 18.0 | 131 | 146.0 |
| I-75 | Florida | 17.9 | 422 | 470.7 |
| I-15 | Nevada | 17.0 | 105 | 123.8 |
| I-10 | Arizona | 16.9 | 333 | 393.0 |
Deaths by year: a 2021 peak and three years of decline
Crashes on main Interstates killed 3,858 people in 2020 and 4,579 in 2021, a rise of 18.7% in one year. The count then fell three years running: 4,323 in 2022, 4,037 in 2023 and 3,872 in 2024. The 2024 figure is 15.4% below the peak and 0.4% above 2020. Across the five years the average was 4,134 deaths a year.
The 2024 number comes from NHTSA's annual file, which is not yet final, and NHTSA revises each year's file when it publishes the final version, so the count may change. The yearly counts cover main Interstates only, so they will not match national traffic death totals, which include every kind of road.
How we counted Interstate crash deaths and built the rates
We counted every fatal crash in NHTSA's Fatality Analysis Reporting System (FARS) from 2020 to 2024 that was coded as an Interstate and whose trafficway name points to a main one- or two-digit route. That comes to 18,387 fatal crashes and 20,669 deaths on 66 routes. Crashes on ramps, exits, frontage roads, service roads and business loops are left out, and so are three-digit routes such as beltways and spurs. Direction letters fold into the route, so "I-10 E" counts as I-10, and the I-35E and I-35W branches count under I-35. A record coded to a state the route never enters is dropped.
Each route's rate is its total deaths divided by five years, divided by its rate miles, times 100. Rate miles start from the FHWA Route Log state rows. The Route Log books pavement two Interstates share to only one of them, while a police report may code a crash on that pavement to either name, so we add the shared miles back to the other route. Shared pavement counts on both routes. Where a Route Log row is a misprint we use a sourced length instead: I-81 in Tennessee is listed at 1.96 miles and we use 75.66. Where the log's overlap notes put shared miles on the wrong row, as on I-55 in Mississippi and I-94 in Wisconsin, we use the route's sourced end-to-end length in that state. Miles not yet signed as Interstate during the study years count as zero, as with I-69 in Tennessee and I-57 in Arkansas. The network rate of 9.5 pools all deaths and rate miles on the 56 ranked routes.
Routes with fewer than 100 rate miles are not ranked, since one bad crash can move a short route's rate by several points. Ten routes fall in that group with 304 deaths between them; they appear in the CSV download without a rate. State stretches need at least 50 miles and must sit on a ranked route of 100 miles or more. The Route Log's main-route table gives Texas I-69 as the mainline only and lists the I-69C, I-69E and I-69W branches in South Texas on their own, so we leave the branches and their crashes out of I-69. Five route numbers belong to two separate roads, I-76, I-84, I-86, I-87 and I-88, and each pair is counted together as one route. I-74's short North Carolina segment counts with the rest of I-74.
The rates do not account for traffic volume, speed limits, weather or how many lanes a road has, so they measure deaths per mile of road, not risk per trip. Crash locations come from police reports, and a trafficway coded with a vague name can miss the route. The 2024 data is preliminary. We do not say why one road ranks above another, because nothing in these files can show that.
Questions about the most dangerous Interstates
What is the most dangerous Interstate in America?
By deaths per mile, I-45 in Texas, with 26.1 deaths per 100 route miles a year from 2020 to 2024. By total deaths, I-10, where crashes killed 1,827 people over the same five years.
Is I-4 the deadliest Interstate?
It is second. I-4 had 25.3 deaths per 100 miles a year from 2020 to 2024, just behind I-45 at 26.1. Older lists that put I-4 first, such as Teletrac Navman's 2021 infographic, used crash data from earlier years.
Which Interstate has the most deaths?
I-10, with 1,827 crash deaths from 2020 to 2024. I-95 is second with 1,668 and I-40 third with 1,380. All three are among the longest Interstates, which pushes their totals up.
Is I-95 the most dangerous highway in the US?
Not on either measure for 2020 to 2024, though it is near the top of both. I-95 ranks second on total deaths with 1,668 and fifth on rate at 17.5. Its Florida stretch, at 30.8 deaths per 100 miles a year, is the deadliest state stretch of 50 miles or more on any Interstate.
What is the safest Interstate?
I-72 in Illinois and Missouri has the lowest death rate of the 56 routes ranked, 1.8 per 100 miles a year, with 16 deaths in five years. I-86 (2.1) and I-29 (2.4) come next. Counts this small can change a lot from one five-year window to the next.
Which states have the deadliest Interstate stretches?
Texas and California each have four of the 25 deadliest state stretches of 50 miles or more, and Florida and Georgia have three each. The top stretch is I-95 in Florida. For deaths on all roads by state, see which states have the deadliest roads.
Why do lists of the most dangerous highways disagree?
They measure different things. Some rank total deaths, some rank deaths per mile, and some mix in US routes that are not Interstates. They also use different years. This ranking covers main Interstates only, with NHTSA FARS data for 2020 to 2024.
Does the death rate account for traffic?
No. It divides deaths by miles of road, because FARS does not carry traffic counts. The rate does not adjust for how many people use a road, so a busy urban Interstate and a quiet rural one are compared on deaths per mile alone. It shows where deaths are concentrated, not the risk of any single trip.
Sources
Related
- Interstate Highway Guide: Every Route by Length and State
- Interstate 45 (I-45): Galveston to Dallas Map, Crash Deaths
- Interstate 95 (I-95): Length, States, Map, Crashes and Tolls
- Which States Have the Deadliest Roads?
- Traffic Deaths by State: 2024 Fatality Rates
- U.S. Roadway Fatalities: What the Data Shows