Interstate Bridge Conditions: Which Routes Have the Most Poor Bridges
Of the 40,245 bridges that carry an Interstate's main line, 1,056 rated Poor in the 2025 National Bridge Inventory, or 2.6 percent. I-57 has the highest Poor share at 10.8 percent, I-90 has the most Poor bridges at 116, and the worst state stretch with 50 or more bridges is I-79 in West Virginia.
- Main-line Interstate bridges, NBI 2025
- 40,245
- Rated Poor
- 1,056
- Share rated Poor
- 2.6%
- Highest Poor share, 10.8%
- I-57
What the 2025 bridge inventory shows for Interstates
- I-57 has the highest Poor share of any Interstate with 100 or more main-line bridges: 10.8 percent, about four times the system figure of 2.6 percent.
- I-90 has the most Poor bridges, 116, which is 11.0 percent of the 1,056 Poor bridges on the whole system.
- Among state stretches with at least 50 bridges, the worst is I-79 in West Virginia, where 33 of 168 main-line bridges rate Poor (19.6 percent).
- Ten routes hold 571 of the Poor bridges between them, 54.1 percent of the national total.
- Fair is the usual rating. It covers 61.5 percent of main-line Interstate bridges; 35.9 percent rate Good.
- Eight routes with at least 100 bridges have none rated Poor, among them I-4 and I-22.
Which Interstates have the highest share of Poor bridges
I-57 has the largest share of main-line bridges rated Poor among Interstates with at least 100 of them: 30 of 277, or 10.8 percent. That is about four times the 2.6 percent for every main-line Interstate bridge in the country. All 30 are in Illinois, which holds 265 of the route's bridges.
Four more routes are above 8 percent: I-82 at 10.1, I-79 at 9.0, I-83 at 8.9 and I-87 at 8.2. Each has between 101 and 366 bridges, so a handful of ratings moves them a long way. On I-82, which has 109, one more Poor bridge would add almost a full point.
Twenty-eight of the 58 ranked routes sit above the system figure. Eight have no Poor main-line bridges at all. Two of the longest routes rank near the bottom: I-10 carries more main-line bridges than any other Interstate, 3,060, and only 21 rate Poor (0.7 percent), while I-35 has 9 Poor bridges out of 1,866 (0.5 percent).
The share counts structures and nothing else. It is not weighted by traffic, length or deck area, so a short rural overpass counts the same as a long river crossing in a city.
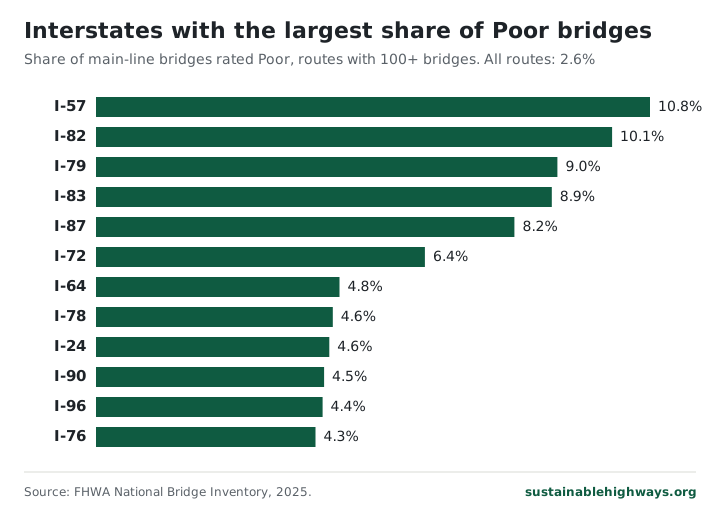
Select a column heading to sort.
| I-57 | 10.8% | 30 | 202 | 45 | 277 | 1967 |
|---|---|---|---|---|---|---|
| I-82 | 10.1% | 11 | 66 | 32 | 109 | 1980 |
| I-79 | 9.0% | 33 | 262 | 71 | 366 | 1972 |
| I-83 | 8.9% | 9 | 80 | 12 | 101 | 1959 |
| I-87 | 8.2% | 18 | 133 | 69 | 220 | 1962 |
| I-72 | 6.4% | 9 | 108 | 23 | 140 | 1976 |
| I-64 | 4.8% | 44 | 710 | 170 | 924 | 1970 |
| I-78 | 4.6% | 10 | 179 | 27 | 216 | 1967 |
| I-24 | 4.6% | 13 | 184 | 88 | 285 | 1971 |
| I-90 | 4.5% | 116 | 1,834 | 652 | 2,602 | 1965 |
| I-96 | 4.4% | 7 | 125 | 26 | 158 | 1962 |
| I-76 | 4.3% | 23 | 311 | 202 | 536 | 1960 |
| I-81 | 4.3% | 40 | 742 | 151 | 933 | 1965 |
| I-89 | 4.2% | 9 | 132 | 73 | 214 | 1966 |
| I-74 | 3.8% | 15 | 236 | 146 | 397 | 1965 |
| I-84 | 3.7% | 27 | 536 | 158 | 721 | 1967 |
| I-5 | 3.6% | 52 | 817 | 566 | 1,435 | 1967 |
| I-80 | 3.6% | 77 | 1,406 | 654 | 2,137 | 1965 |
| I-49 | 3.5% | 23 | 298 | 332 | 653 | 1989 |
| I-70 | 3.5% | 67 | 1,129 | 717 | 1,913 | 1967 |
| I-25 | 3.3% | 34 | 721 | 289 | 1,044 | 1968 |
| I-85 | 3.1% | 15 | 285 | 185 | 485 | 1969 |
| I-94 | 2.8% | 25 | 595 | 267 | 887 | 1968 |
| I-77 | 2.8% | 18 | 393 | 236 | 647 | 1973 |
| I-29 | 2.8% | 13 | 313 | 144 | 470 | 1972 |
| I-40 | 2.7% | 63 | 1,391 | 863 | 2,317 | 1967 |
| I-91 | 2.7% | 11 | 294 | 101 | 406 | 1965 |
| I-26 | 2.7% | 8 | 179 | 109 | 296 | 1969 |
| I-55 | 2.5% | 21 | 594 | 220 | 835 | 1965 |
| I-30 | 2.3% | 11 | 328 | 133 | 472 | 1966 |
| I-95 | 2.2% | 45 | 1,382 | 617 | 2,044 | 1967 |
| I-86 | 1.9% | 6 | 205 | 110 | 321 | 1973 |
| I-69 | 1.8% | 13 | 350 | 371 | 734 | 1981 |
| I-93 | 1.6% | 5 | 180 | 122 | 307 | 1968 |
| I-20 | 1.6% | 25 | 1,120 | 397 | 1,542 | 1967 |
| I-65 | 1.6% | 13 | 532 | 271 | 816 | 1967 |
| I-75 | 1.4% | 20 | 577 | 867 | 1,464 | 1971 |
| I-44 | 1.3% | 7 | 308 | 217 | 532 | 1964 |
| I-88 | 1.3% | 3 | 174 | 55 | 232 | 1975 |
| I-71 | 1.2% | 4 | 119 | 200 | 323 | 1966 |
| I-15 | 1.1% | 13 | 742 | 456 | 1,211 | 1975 |
| I-39 | 1.1% | 3 | 172 | 109 | 284 | 1987 |
| I-45 | 1.0% | 4 | 240 | 160 | 404 | 1974 |
| I-41 | 0.9% | 2 | 87 | 139 | 228 | 2011 |
| I-66 | 0.9% | 1 | 96 | 17 | 114 | 1979 |
| I-10 | 0.7% | 21 | 1,508 | 1,531 | 3,060 | 1969 |
| I-43 | 0.7% | 2 | 251 | 53 | 306 | 1976 |
| I-8 | 0.6% | 2 | 138 | 218 | 358 | 1966 |
| I-59 | 0.5% | 2 | 293 | 100 | 395 | 1965 |
| I-35 | 0.5% | 9 | 1,005 | 852 | 1,866 | 1970 |
| I-19 | 0.0% | 0 | 36 | 106 | 142 | 1969 |
| I-17 | 0.0% | 0 | 59 | 62 | 121 | 1967 |
| I-99 | 0.0% | 0 | 58 | 54 | 112 | 2001 |
| I-37 | 0.0% | 0 | 85 | 96 | 181 | 1972 |
| I-16 | 0.0% | 0 | 37 | 102 | 139 | 1971 |
| I-12 | 0.0% | 0 | 63 | 44 | 107 | 1970 |
| I-22 | 0.0% | 0 | 127 | 109 | 236 | 1991 |
| I-4 | 0.0% | 0 | 41 | 115 | 156 | 2007 |
I-90 carries the most Poor bridges of any Interstate
I-90 has 116 main-line bridges rated Poor, more than any other Interstate and 11.0 percent of the system total. Three states hold most of them. Washington has 40, and New York and Massachusetts have 23 each, for 86 of the 116.
Raw counts mostly track how many bridges a route has. I-80 (77 Poor), I-70 (67) and I-40 (63) come next, yet their shares are all within about a point of the 2.6 percent system figure. Together the ten routes in this table hold 571 Poor bridges, 54.1 percent of the 1,056.
Within a route, the Poor bridges often cluster in one state. On I-5, 46 of the 52 are in California, and on I-70, 30 of 67 are in Colorado. I-95 has 45 Poor bridges, but they are only 2.2 percent of its 2,044, below the system figure.
Select a column heading to sort.
| I-90 | 116 | 2,602 | 4.5% |
|---|---|---|---|
| I-80 | 77 | 2,137 | 3.6% |
| I-70 | 67 | 1,913 | 3.5% |
| I-40 | 63 | 2,317 | 2.7% |
| I-5 | 52 | 1,435 | 3.6% |
| I-95 | 45 | 2,044 | 2.2% |
| I-64 | 44 | 924 | 4.8% |
| I-81 | 40 | 933 | 4.3% |
| I-25 | 34 | 1,044 | 3.3% |
| I-79 | 33 | 366 | 9.0% |
The worst state stretches, led by I-79 in West Virginia
Among route and state pairs with at least 50 main-line bridges, the worst is I-79 in West Virginia, where 33 of 168 main-line bridges rate Poor, or 19.6 percent. Those 33 are every Poor bridge on the route. Its 198 bridges in Pennsylvania include none.
I-84 in New York is second at 19.1 percent (18 of 94), and I-90 in Washington third at 16.3 percent (40 of 246). Both routes look very different elsewhere. I-84 has 1 Poor bridge among 206 in Oregon, and I-90 has 1 among 268 in South Dakota.
Illinois appears five times in the top 20, on I-70, I-80, I-57, I-94 and I-64. New York appears four times. The table needs at least 50 bridges in the state, so short pieces drop out: I-70's 23 bridges in West Virginia, 3 of them Poor, fall below that floor.
Select a column heading to sort.
| I-79 | West Virginia | 19.6% | 33 | 168 |
|---|---|---|---|---|
| I-84 | New York | 19.2% | 18 | 94 |
| I-90 | Washington | 16.3% | 40 | 246 |
| I-70 | Illinois | 11.8% | 14 | 119 |
| I-80 | Illinois | 11.4% | 17 | 149 |
| I-82 | Washington | 11.3% | 11 | 97 |
| I-57 | Illinois | 11.3% | 30 | 265 |
| I-80 | California | 11.3% | 19 | 168 |
| I-40 | California | 10.5% | 21 | 200 |
| I-83 | Pennsylvania | 10.3% | 6 | 58 |
| I-81 | New York | 9.9% | 18 | 181 |
| I-49 | Missouri | 9.8% | 17 | 173 |
| I-94 | Illinois | 9.8% | 5 | 51 |
| I-64 | West Virginia | 9.0% | 14 | 156 |
| I-90 | Massachusetts | 8.9% | 23 | 259 |
| I-95 | Massachusetts | 8.8% | 10 | 114 |
| I-90 | New York | 8.8% | 23 | 263 |
| I-87 | New York | 8.5% | 18 | 213 |
| I-24 | Tennessee | 8.4% | 13 | 155 |
| I-64 | Illinois | 8.1% | 10 | 124 |
Older routes rate Poor more often, with exceptions
I-83 has the oldest main-line bridges of any Interstate with 100 or more: half were built in 1959 or earlier. I-76 follows with a median of 1960, then I-87 and I-96 at 1962. Thirty-two of the 58 ranked routes have a median year in the 1960s.
Age and condition move together, though loosely. Pooled, the 12 ranked routes with a median of 1965 or earlier have 3.7 percent of their bridges rated Poor. The 13 with a median of 1975 or later have 1.8 percent. Some routes break the pattern. I-44, with a median of 1964, has 1.3 percent Poor, half the system figure, while I-82, with a median of 1980, has the second highest share at 10.1 percent.
The youngest sets of bridges are on I-41 (median 2011), I-4 (2007) and I-99 (2001). The median uses the year built recorded for each bridge, so a later deck replacement or widening does not make a bridge count as newer.
Select a column heading to sort.
| I-83 | 1959 | 101 | 8.9% |
|---|---|---|---|
| I-76 | 1960 | 536 | 4.3% |
| I-87 | 1962 | 220 | 8.2% |
| I-96 | 1962 | 158 | 4.4% |
| I-44 | 1964 | 532 | 1.3% |
| I-55 | 1965 | 835 | 2.5% |
| I-59 | 1965 | 395 | 0.5% |
| I-74 | 1965 | 397 | 3.8% |
| I-80 | 1965 | 2,137 | 3.6% |
| I-81 | 1965 | 933 | 4.3% |
| I-90 | 1965 | 2,602 | 4.5% |
| I-91 | 1965 | 406 | 2.7% |
How we counted Interstate bridges and their ratings
We counted every structure in FHWA's 2025 National Bridge Inventory whose record names an Interstate as the route on the bridge at the main-line service level (NBI Items 5A, 5B and 5C). Ramps and frontage roads are left out, and so are bridges that carry another road over an Interstate. That gives 40,245 bridges on 65 routes. I-2 in Texas has no bridges filed under its number, so it has no row.
Condition is FHWA's Good, Fair or Poor classification as stored in the inventory. FHWA takes the lowest of four component ratings (deck, superstructure, substructure and culvert). A lowest rating of 4 or under makes the bridge Poor, 5 or 6 makes it Fair, and 7 to 9 makes it Good. Every bridge in the count had one of the three.
News stories and ARTBA's yearly bridge report still use the older label "structurally deficient." FHWA changed that term's definition starting with the 2018 data and now marks its deficient-bridge tables as archived; its current condition tables report Good, Fair and Poor. Under the definition used since 2018, as ARTBA describes it, a bridge is structurally deficient when any of the same four components rates 4 or lower. That is the test for Poor, so in 2018 and later data the two labels pick out the same bridges. Earlier counts also took in bridges with low appraisal ratings for structural evaluation or waterway openings, so they do not compare directly with Poor counts.
Poor share is the number of Poor bridges divided by all main-line bridges on the route or stretch. The route rankings include only the 58 routes with at least 100 main-line bridges, and the stretch table only route and state pairs with at least 50, because a short list swings on one or two ratings. The CSV download covers all 65 routes. Median year built ignores recorded years outside 1901 to 2025.
We read only the number in the inventory's route field (Item 5D) and ignore any letter, so bridges on lettered branches such as I-35E and I-35W count under I-35. We dropped the I-69C, I-69E and I-69W branches in South Texas and any record coded to a route in a state that route does not enter. Each record names one route, so where two Interstates share pavement, a bridge counts only for the route the state wrote down.
These figures are a 2025 snapshot built from each bridge's most recent inspection on file in the 2025 inventory. They do not account for traffic, bridge length or deck area, and they do not explain why one route rates worse than another. A Poor rating means at least one major component rated 4 or lower at its last inspection. FHWA has written that a structurally deficient bridge is not necessarily unsafe, and that strictly obeying signs that limit traffic or speed on the bridge will generally keep users safe.
Questions about Interstate bridge conditions
Which Interstate has the most bridges in poor condition?
I-90, with 116 main-line bridges rated Poor in the 2025 National Bridge Inventory. I-80 is next with 77 and I-70 third with 67. On I-90, Washington has 40 of the Poor bridges and New York and Massachusetts 23 each.
Which Interstate has the highest share of bridges in poor condition?
Among routes with at least 100 main-line bridges, I-57 has the highest share: 30 of 277, or 10.8 percent, all of them in Illinois. I-82 is second at 10.1 percent and I-79 third at 9.0 percent.
What percent of Interstate bridges are structurally deficient?
Of the 40,245 bridges that carry an Interstate main line, 1,056 rate Poor, or 2.6 percent. Since FHWA's 2018 definition change, Poor and structurally deficient describe the same bridges. Another 61.5 percent rate Fair and 35.9 percent rate Good.
What does structurally deficient mean for a bridge?
Under the definition used since the 2018 data, a bridge is structurally deficient when its deck, superstructure, substructure or culvert rates 4 or lower at inspection. FHWA uses that same test to classify a bridge as Poor. Before 2018 the label also covered bridges with low appraisal ratings for structural evaluation or waterway openings.
Is a bridge rated Poor unsafe to cross?
A Poor rating alone does not make a bridge unsafe. FHWA has written that a structurally deficient bridge is not necessarily unsafe, and that strict observance of signs limiting traffic or speed on it will generally provide adequate safeguards. Poor means the deck, superstructure, substructure or culvert rated 4 or lower at the last inspection.
What are the worst bridges in America?
This study ranks Interstate routes and state stretches, not single bridges. Among stretches with at least 50 bridges, the worst in the 2025 inventory is I-79 in West Virginia, where 33 of 168 main-line bridges rate Poor (19.6 percent). By route, I-57 has the highest Poor share and I-90 the most Poor bridges.
How old are Interstate bridges?
Among routes with at least 100 main-line bridges, the median year built runs from 1959 on I-83 to 2011 on I-41. Thirty-two of those 58 routes have a median in the 1960s, including I-80 and I-90 (1965) and I-40, I-70 and I-95 (1967).
How many bridges are on the Interstate Highway System?
This study counts 40,245 bridges that carry an Interstate's main line in the 2025 inventory. Ramps, frontage roads and bridges that carry other roads over an Interstate are not in that number, so a count that includes them will be higher.
Sources
- 2025 NBI ASCII files (delimited, all states)
- Recording and Coding Guide for the Structure Inventory and Appraisal of the Nation's Bridges (FHWA-PD-96-001)
- Tables of Frequently Requested NBI Information
- Deficient Bridges by Highway System (archived)
- About the Report
- Our Nation's Highways: 2008, Figure 7-4